Optimizing Go program with pprof and tracer
Optimizing rndimage
package rndimage

import "testing"

func BenchmarkGenerate1000(t *testing.B) {
	for i := 0; i < t.N; i++ {
		Generate(1000, 1000)
	}
}
Running benchmark test with enabled pprof:
go test -cpuprofile ./cpu.prof -bench BenchmarkGenerate1000 ./pkg/rndimage/
Let’s remember the output for future comparisons:
chmarkGenerate1000 ./pkg/rndimage/
goos: linux
goarch: amd64
pkg: github.com/svlapin/rndimage/pkg/rndimage
BenchmarkGenerate1000-4   	      10	 165763331 ns/op
PASS
ok  	github.com/svlapin/rndimage/pkg/rndimage	2.012s
2 seconds to generate 1000x1000px image, with pprof enabled, though.
Let’s dive into, running:
go tool pprof cpu.prof
and then typing top -cum to see the entries were the most of CPU was spent, sorting by cumulative weight:
(pprof) top -cum
Showing nodes accounting for 0.24s, 13.19% of 1.82s total
Showing top 10 nodes out of 39
      flat  flat%   sum%        cum   cum%
         0     0%     0%      1.81s 99.45%  github.com/svlapin/rndimage/pkg/rndimage.BenchmarkGenerate1000
     0.04s  2.20%  2.20%      1.81s 99.45%  github.com/svlapin/rndimage/pkg/rndimage.Generate
         0     0%  2.20%      1.81s 99.45%  testing.(*B).runN
         0     0%  2.20%      1.65s 90.66%  testing.(*B).launch
         0     0%  2.20%      1.41s 77.47%  github.com/svlapin/rndimage/pkg/rndimage.randomUint8
     0.05s  2.75%  4.95%      1.41s 77.47%  math/rand.Intn
     0.05s  2.75%  7.69%      1.36s 74.73%  math/rand.(*Rand).Intn
     0.04s  2.20%  9.89%      1.31s 71.98%  math/rand.(*Rand).Int31n
     0.01s  0.55% 10.44%      1.27s 69.78%  math/rand.(*Rand).Int31
     0.05s  2.75% 13.19%      1.26s 69.23%  math/rand.(*Rand).Int63
The top 4 entries don’t make a lot of sense since they’re more or less obvious - point to either test package (testing.(*B).runN and testing.(*B).launch), the entry function of the module under test (rndimage.Generate) or the benchmark function (rndimage.BenchmarkGenerate1000). The 5th entry gives a decent idea on what we really spend time on - generating a random number, and takes 77% of the total CPU time.
Can we improve this somehow?
Go execution tracer
To have a more detailed and accurate overview of what’s happening during the execution, let’s use runtime/trace package.
Creating a tracer profile when running benchmarks is as simple as
go test -trace=trace.out -bench BenchmarkGenerate1000 ./pkg/rndimage/
Let’s open created profile trace.out with a trace go tool:
go tool trace trace.out
Parses the output file and opens a browser:
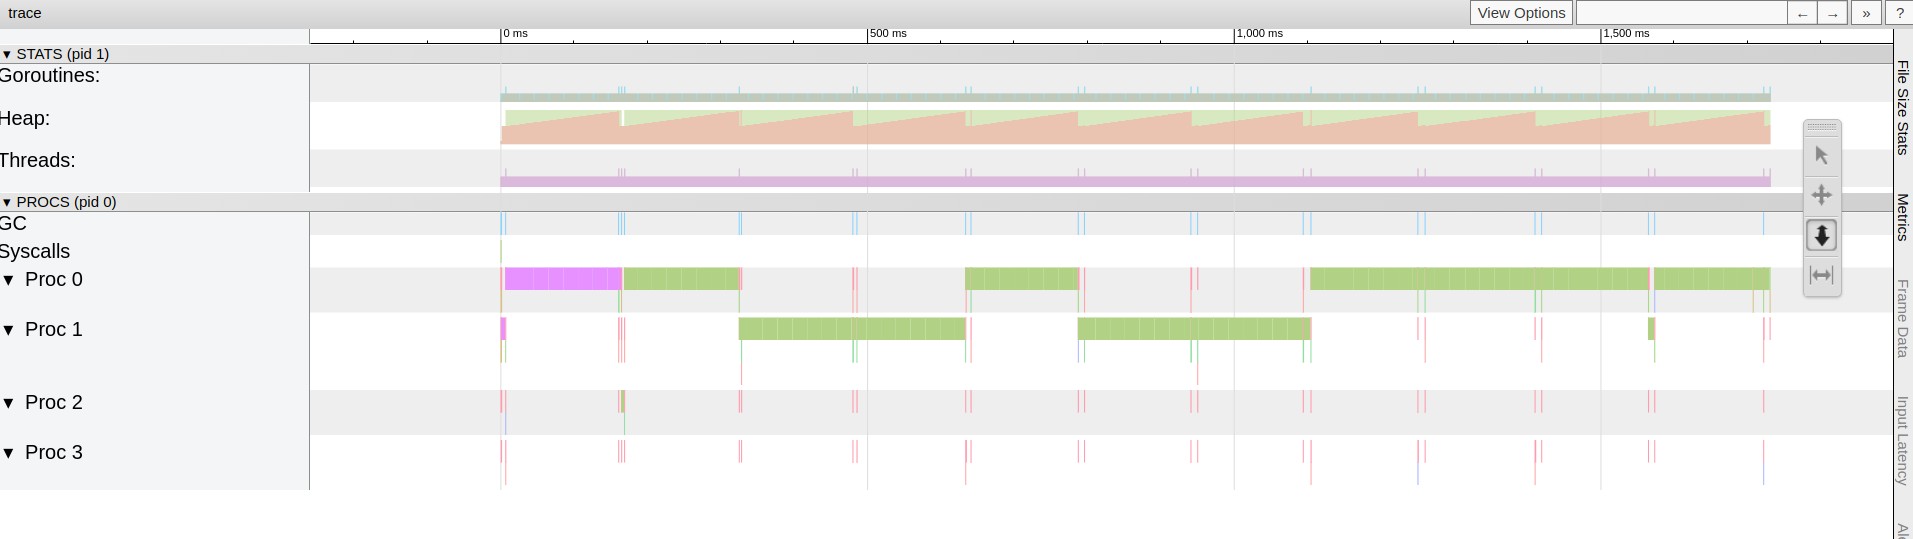
Observations from the charts:
- garbage collector runs 11 times during the execution
- program utilizes 1 CPU only out of 4 - although execution switches between the cores, at the same time only one is used.
Let’s try to make the program utilize all available CPUs and make it create a goroutine for each inner loop step:
diff --git a/pkg/rndimage/generate.go b/pkg/rndimage/generate.go
index e4859e9..ef48a56 100644
--- a/pkg/rndimage/generate.go
+++ b/pkg/rndimage/generate.go
@@ -4,26 +4,41 @@ import (
 	"image"
 	"image/color"
 	"math/rand"
+	"sync"
 )

 func randomUint8() uint8 {
 	return uint8(rand.Intn(256))
 }

+func getColor() color.RGBA {
+	return color.RGBA{
+		R: randomUint8(),
+		G: randomUint8(),
+		B: randomUint8(),
+		A: randomUint8(),
+	}
+}
+
 // Generate - generates `image.RGBA` of given `width` and `height` filling it with random pixel colors
 func Generate(width, height int) *image.RGBA {
 	rgba := image.NewRGBA(image.Rectangle{Min: image.Point{0, 0}, Max: image.Point{width, height}})
+	var wg sync.WaitGroup
+
+	wg.Add(width * height)

 	for i := 0; i < width; i++ {
 		for k := 0; k < height; k++ {
-			rgba.Set(i, k, color.RGBA{
-				R: randomUint8(),
-				G: randomUint8(),
-				B: randomUint8(),
-				A: randomUint8(),
-			})
+			go func(i, k int) {
+				color := getColor()
+				rgba.Set(i, k, color)
+				wg.Done()
+			}(i, k)
 		}
 	}

+	wg.Wait()
+
 	return rgba
 }
After creating trace the same way and opening go tool trace, we can see the following:
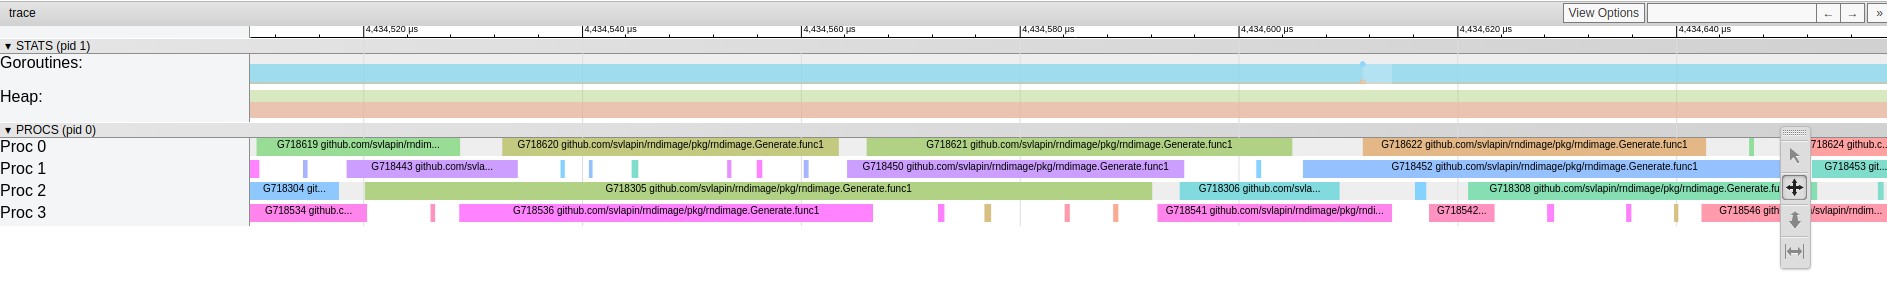
Program seems to utilize all available CPUs now, but execution time is about the same.
Giving the chart a decent zoom-in reveals the problem: CPU utilization chart doesn’t look dense. The reason for that is creating too many goroutines and so putting a lot of pressure on scheduler.
That’s not the only reason though.
With digging into pprof it’s quite obvious to see that mutex.Lock and Unlock take significant amout of CPU time. Breif look at the docs confirmed my guess:
The default Source is safe for concurrent use by multiple goroutines, but Sources created by NewSource are not
So solution is simple - use rand.NewSource per goroutine.
That said, combining into the final solution:
var wg sync.WaitGroup
wg.Add(width)

for i := 0; i < width; i++ {
  go func(i int) {
    rand := rand.New(rand.NewSource(rand.Int63()))
    for k := 0; k < height; k++ {
      rgba.Set(i, k, color.RGBA{
        R: uint8(rand.Intn(256)),
        G: uint8(rand.Intn(256)),
        B: uint8(rand.Intn(256)),
        A: uint8(rand.Intn(256)),
      })
    }
    wg.Done()
  }(i)
}

wg.Wait()
On a 3000x3000 picture it shows 2x improve.
Take-aways
pprofandtraceare really cool and easy to work with- some standard library convenience methods make use of mutex toe be thread-safe. Check the docs or source when in doubt.